What's it about?
Freeform applications are growing and include helmet-mounted displays, conformal optics (e.g. windows integrated into airplane wings), and those requiring the extreme precision of EUV. These non-rotationally symmetric surfaces pose challenges to optical fabrication, mostly in the areas of polishing and metrology. The varying curvature of freeform surfaces drives the need for smaller, more “conformal” tools for polishing and reference beams for interferometry. In this paper, we present the fabrication results of a high-precision freeform surface. We will discuss the total manufacturing process, including generation, pre-polishing, MRF®, and metrology, highlighting the capabilities available in today’s optical fabrication companies.
Non-rotationally symmetric freeform surfaces are becoming more common in optical systems and are driving a need for better polishing and metrology techniques. Lack of symmetry, along with rapidly varying local slope and curvature, increase the challenges during all aspects of fabrication. Recent advances in polishing and metrology have addressed many of these difficulties, and the manufacture of freeform surfaces is possible today. In addition to the increased complexity that these surfaces cause for manufacturing, challenges also exist with the definition of the nominal surface, tolerancing, proper best-fitting of the nominal shape to the measured shape, and final analysis against the specification. Similar challenges have existed with aspheres and will only become more important with freeform surfaces.
In this paper we will discuss the manufacturing process of a wild freeform optic. The optic was designed by QED Technologies, Rochester, NY with no specific application, but rather to demonstrate the current capabilities available for manufacturing freeform optical components. Generation and pre-polishing were completed by Optimax Systems, Ontario, NY using commercially available equipment. Optimax also measured the optic on a coordinate measuring machine to obtain the full aperture metrology required to drive the fabrication process. QED performed the final figuring using Magnetorheological Finishing (MRF®), as well as high resolution interferometric measurements using subaperture stitching interferometry.
FREEFORM DESIGN, GENERATION & PRE-POLISHING
QED chose to design a freeform surface with an extreme shape that would push the limits of current technology. The surface has a rectangular aperture with a width of 65 mm and height of 40 mm, with truncated 5 mm x 5 mm triangular regions in the corners.
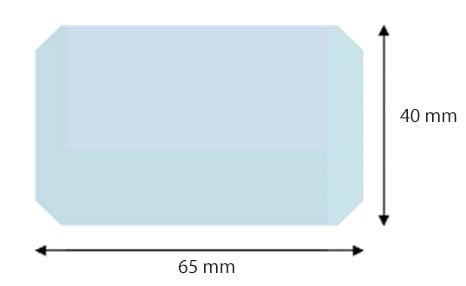
Figure 1 Freeform surface aperture, showing outer dimensions and truncated corners
The surface deviates significantly from a sphere and becomes progressively more extreme towards the edges of the part. Over a central 40 mm diameter, the shape is concave with mostly astigmatic departure; over 40 mm - 55 mm, higher- order rotationally-symmetric departure increases and the local curvature changes from concave to convex; over the outer 55 mm - 70 mm diameter, the higher-order rotationally-symmetric departure continues to increase, producing very high- slope regions in the corner of the rectangular optic. Additionally, the surface is tilted by 10 degrees about the horizontal axis to produce wedge, effectively causing the part to act as an off-axis surface from a fabrication point of view. Figure 2 shows a 3-D view of this freeform without the corners truncated.
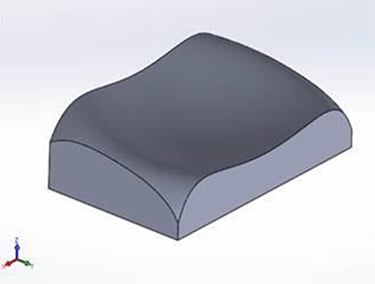
Figure 2 Surface drawing, without truncated corners
The surface was created by first designing a Q-polynomial1 freeform surface over a 55 mm circular aperture. The prescription over this aperture is as follows: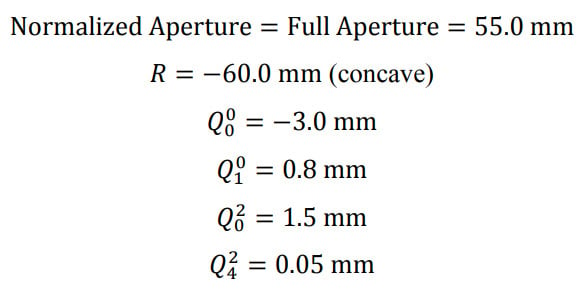
In order to generate a more extreme shape, the full aperture was increased to a 76 mm diameter, while keeping the normalized aperture set to 55 mm. This is not the intended use of the Q-polynomials (the surface should not extend beyond the normalized aperture), but it was a convenient way to generate the desired extreme surface shape over the full part aperture. The surface was then tilted by 10 degrees about the horizontal axis for added complexity. Finally, the aperture was set to the truncated rectangle described above. The part is made from fused silica.
A map of the surface sag and surface slope is shown below in Figure 3. The total sag is over 11 mm, and the surface slope is as high as 1.6 (58 degrees).
The required input to several of the machines used in the manufacturing process is a solid model of the desired surface. Using a CAD software package, a solid model was fit to a point cloud generated from the original Q-polynomial surface definition. This method produced good correlation in the low order shape, but showed some smaller features at higher frequencies, especially on the steep edges. This is shown by the small ripple in the ‘zebra stripes’ picture in Figure 4. For this part, we treated the solid model, with the small high-frequency ripple, as the new nominal design. More work is needed to determine an optimal method for generating a solid model with higher fidelity to the mathematical description of the surface.
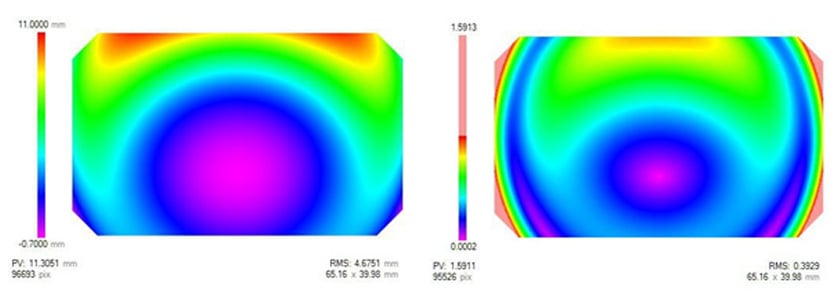
Figure 3 Surface sag (left) and surface slope (right). Surface slope is displayed as a unitless value.
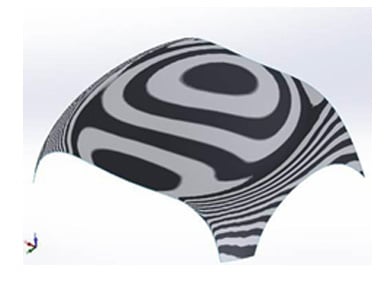
Figure 4 Visualization of surface in CAD software package (note that the black and white lines are not meant to represent interferometric fringes).
The freeform part was made by Optimax with generation and pre-polishing processes. In generation, Optimax used a five-axis CNC machining center with ultrasonic assistance, with various types of spherical ball tooling to produce a part with the desired surface form.
After the initial generation step, it is possible to perform a deterministic surface form error correction, still using the generator. This is accomplished by measuring the surface form error with the coordinate measuring machine, making a new generation hit map with that result, and then re-generating the surface with the new hit map. With this method, we can accurately produce generated freeform surfaces with less than 10 μm of form error PV. However, for the freeform surface presented here, we did not have time to run the generation correction procedure. Therefore, the post-generation surface form error is high, around 165 μm PV. As the goal of this research study was to primarily focus on metrology and final figuring, we decided to accept the part as is. In later process steps, our goal will be to show convergence in the surface form error, not to correct exactly to the original nominal surface shape.
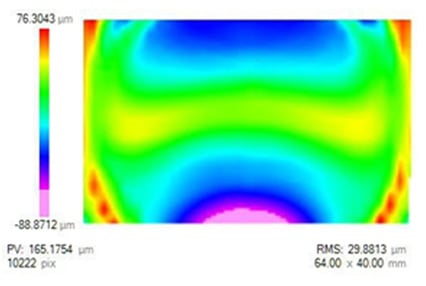
Figure 5 Figure error after final pre-polishing step
Optimax can polish a freeform surface, using multiple methods, to remove all sub-surface damage. We have demonstrated the ability of VIBE polishing, a high-speed polishing process with custom conformal tooling, to polish various shapes including conformal windows (Optimax)2. VIBE is well suited for hard crystalline materials due to its high removal rates. For non-crystalline materials, and parts smaller than 75 mm diameter like the freeform presented here, sub-aperture polishing is an alternative. We choose to use a Satisloh AII CNC sub-aperture polishing platform for this freeform. The tooling is a pressure filled bonnet with a polishing pad. The input for the sub-aperture polishing
platform is a cloud of XYZ points of the surface. These points were generated from the Q-polynomial definition of the nominal shape.
The polishing step was successful at smoothing the majority of the grinding damage, including the edge regions where the curvature turns from concave to convex. Figure 6 shows a photograph of the optic after this pre-polish step, showing the quality of the smooth, polished-out surfaces of this extreme freeform.
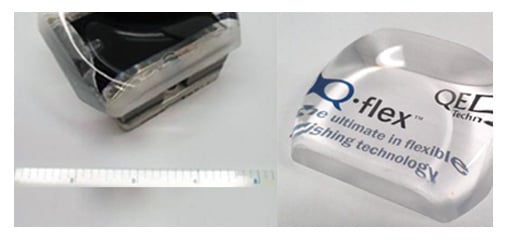
Figure 6 Picture of the optic after pre-polishing (left), and after MRF polishing (right)
Surface form measurements were done on a Leitz PMM 866 coordinate measuring machine (Figure 7) with certified volumetric accuracy of 1.2 μm + L/400 μm (where L is measured length in mm). The probe is a ruby sphere attached to a scanning head which scans at constant force near 0.3 N. Typically, the surface was measured with a series of lines scanned across the surface. Along the lines (the direction of the scan), the point lateral spacing is approximately 0.4 mm and the lateral spacing between the lines is approximately 2 mm.
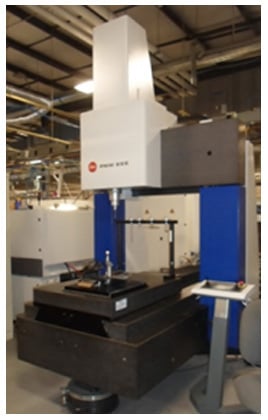
Figure 7 Photograph of the Leitz CMM at Optimax
For the measurement, the CMM software uses the nominal surface shape (as a solid model) and user input to approximately locate the shape in space. The surface is then scanned and the CMM software performs a best fit operation to remove misalignments between the nominal shape and the measured shape. The output from the CMM is a set of XYZ points for both the nominal and measured shapes and the IJK vectors normal to the nominal shape. The deviation along the normal vector is then calculated in Matlab, outside the CMM software. To calculate this normal deviation, we first find the deviation vector between the measured and nominal points and then project that vector onto the normal vectors using the angle between the deviation vector and the normal vector. This results in an unequally laterally spaced set of normal deviation points. We then fit this set of points to an evenly spaced grid (typically 0.5 mm to 1 mm lateral spacing). This fitting is required for display purposes and for input into typical optical manufacturing equipment. Errors in this fit, from interpolation and from uneven distribution along the slope of the test part, are possible and should be considered when the results are examined.
If a metrology tool is used to drive a deterministic polishing process or used for final quality assurance, it is important to understand the accuracy, repeatability, and reproducibility of the tool on the part being measured. To evaluate repeatability, the pixel-by-pixel difference of successive measurements of figure error was evaluated at two different stages in the fabrication process. The non-repeatability has several different forms: low-order error in the central ~55 mm region, isolated mid-spatial frequency errors, and high-amplitude mid-spatial frequency errors in each of the four corners of the optic. Figure 8 shows the result of two separate repeatability tests with the isolated mid-spatial frequency errors and corner regions removed. Over this aperture, the repeatability is better than 0.5 μm rms.
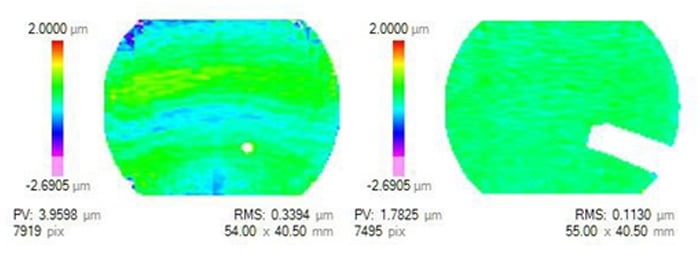
Figure 8 Surface maps showing repeatability of CMM measurements (pixel-by-pixel difference of successive measurements) performed after the first MRF polishing run (left) and after the second MRF polishing run (right). The data is masked to a 55mm circular diameter; the color scale is +/- 2 μm.
More work is needed to try to improve the repeatability on freeform surfaces like this. Optimax began an investigation into different measurement strategies, and very promising results were achieved when individually probed points (as opposed to scanned lines) were included in the measurement. When this technique was used, the repeatability improved to better than 0.2 μm rms over the full part aperture, with only isolated high-frequency errors. This work was done after all the figure correction runs were completed, so data obtained using this method was not used as input for any of the processing that is reported in this paper.
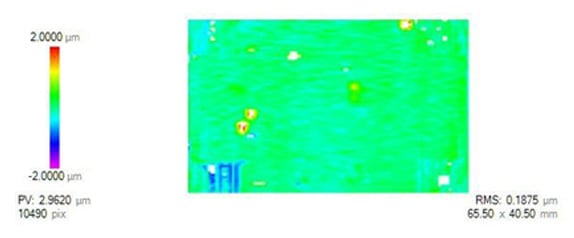
Figure 9 Repeatability of CMM measurements (pixel-by-pixel difference of successive measurements) with a combination of probed and scanned points.
DETERMINISTIC FREEFORM FIGURE CORRECTION
Deterministic freeform figure correction was performed by QED using MRF. QED polished the freeform surface using a Q-flex™ 100 polishing machine. The Q-flex 100 can polish planos, spheres, aspheres, and freeform surfaces up to 120 mm x 120 mm in size. Freeform polishing on the Q-flex 100 utilizes a raster toolpath with three translation axes (X,Y,Z), a rotation axis (B), and a virtual axis “around the wheel” of the MRF polishing head. The freeform surface is kept normal to, and a constant distance from, the MRF wheel at the region where polishing is occurring. This ensures that the removal rate is nearly constant everywhere on the surface3.
The Q-flex 100 is capable of polishing freeform surfaces with millimeters of departure and half angles of up to 45 degrees in the direction of the virtual axis (along the height of this part) and up to 90 degrees in the direction of the physical B axis (along the width of this part). In addition to the slope limits, the local concave radius must not approach the radius of the MRF wheel (10, 25, or 75 mm radii wheels are available for the Q-flex 100). The 20 mm diameter wheel was used for this freeform optic.
In order to achieve the high convergence that is possible with MRF, the removal function of the system (the MRF “spot”) must be accurately characterized prior to polishing. With a freeform surface, spots can be taken on either a best- fit sphere or a plano surface. For simplicity, and because the local radius of the freeform surface changes significantly from concave to convex (the best-fit radius is nearly plano), a plano part was used for spots.
Two polishing runs of ~20 hours each were conducted on the freeform surface to correct just over 10 µm of figure error. Since the figure error after grinding and pre-polishing was still quite different from the nominal shape, we decided to demonstrate convergence instead of targeting our original nominal shape (165 µm of figure error is beyond the practical limit of what MRF can correct). Because of the uncertainty in the high-frequency figure error reported by the CMM, we attempted a correction of mostly low-order error. Additionally, since the uncertainty in the CMM measurements was significantly higher near the corners of the aperture, results will be reported after masking the aperture to a 55 mm circular diameter. The results of the individual polishing runs, along with the total change in figure error, are displayed in Figure 10. The “predicted” error is an output of the toolpath generation process, which takes the part figure error and removal spot as inputs, and generates a dwell map over the surface. Because of the finite size of the spot and the conformal nature of MRF polishing, high-spatial frequency features are not efficiently corrected; the predicted map takes this into account and reports the error that the software believes will be corrected. The removal that is shown in Figure 10 is the difference between the before-polishing and the after-polishing metrology. These maps will also show measurement non-repeatability/non-reproducibility. The rightmost column of Figure 10 shows the total predicted and actual removal after two polishing runs; over the 55 mm circular aperture, the convergence is quite good, and apart from the high-frequency features that were either purposefully not corrected or can be attributed to metrology errors, the surface maps look quite similar.
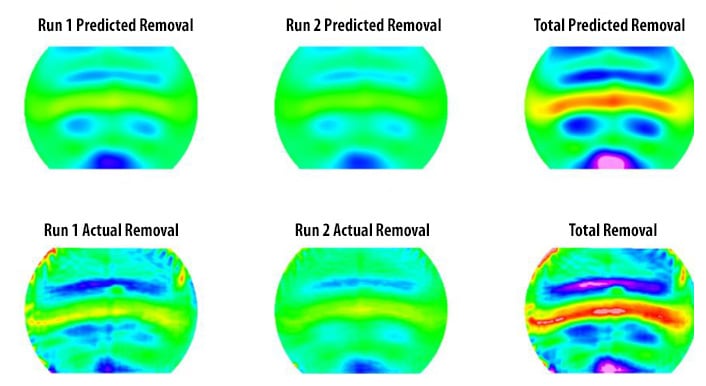
Figure 10 Summary of results. Color scale is +/- 5 µm. Total predicted rms removal is 2.0 µm; actual total rms removal is 2.3µm.
The line graph shown in Figure 11 is a vertical trace through the center of the maps shown on the right side of Figure 10. This also shows overall good convergence of the low-o der figure error.
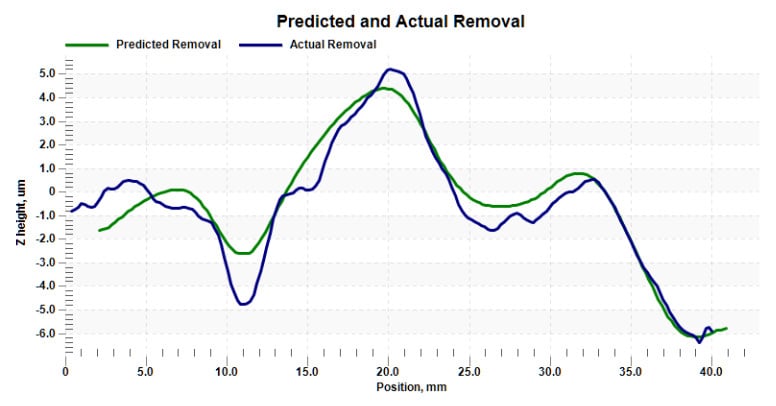
Figure 11 Vertical line trace through the center of the Total Removal plots (rightmost images) of Figure 10
It is possible that the actual convergence is better than what is shown in Figure 10 and Figure 11, as metrology artifacts from the first measurement may be affecting the calculation of the actual removal. The measurements before and after the second polishing run were mostly free of artifacts inside the 55 mm circular aperture, and the convergence for that polishing run appears to be higher.
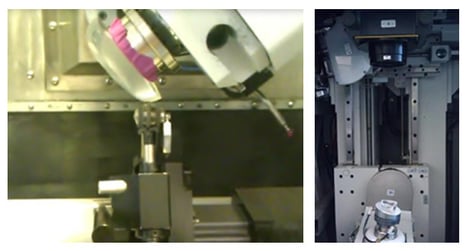
Figure 12 Photographs of the freeform part being polished on the Q-flex 100 and measured on the ASI
ASI METROLOGY
The CMM was capable of very repeatable measurements over most of the part, but there were still many isolated high- frequency measurement artifacts; more confidence is needed in the mid to high-spatial frequency errors. QED’s Aspheric Stitching Interferometer (ASI®) excels at measuring mid-spatial frequency errors4. While the commercially available version of the ASI is able to measure planos, spheres, and rotationally-symmetric aspheres, QED has extended and generalized portions of the stitching process to create a development version of software that can be used to measure a range of freeform surfaces. The ASI can be used to measure the central region of this freeform surface.
The surface was measured using a 4” f/7.2 transmission sphere, giving a field of view in the center of the part of approximately 5 mm. Over this region, the departure from the local best-fit sphere is approximately 16 µm of primarily astigmatism. If a larger field of view is used, the high departure from a best-fit sphere would result in fringes that exceeded the Nyquist limit, causing dropout in the measurement. Stitching allows us to maintain this small field of view, over which the fringes are resolvable, and stitch a lattice of subapertures that gives a measurement over a much larger area than would be possible with conventional interferometry. The synthetic fringes for a subaperture measurement are shown in Figure 13; these fringes show the measured error from the local best-fit sphere over the central 5 mm of the freeform surface.
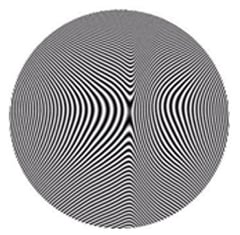
Figure 13 Synthetic fringes showing the measured error from best-fit sphere over the central 5mm of the freeform surface.
A preliminary stitched measurement was acquired over the central 28 mm. We ultimately expect to be able to measure over a 40 mm aperture. The stitched measurement contains approximately 1200 pixels across the measured aperture, compared with approximately 60 pixels in the CMM measurement over this region. As shown in the top row of Figure 14, the measured low-order figure error is very similar in the ASI and CMM measurements. The measurements also agree rather well in the middle and bottom rows of Figure 14, but the ASI measurement can clearly measure more mid- spatial frequency features with much higher resolution. The most striking difference between the bottom two rows of this figure is the missing vertical “stripe” in the CMM data. It should be noted that this feature is a real feature that is visible by eye – it is not a metrology artifact.
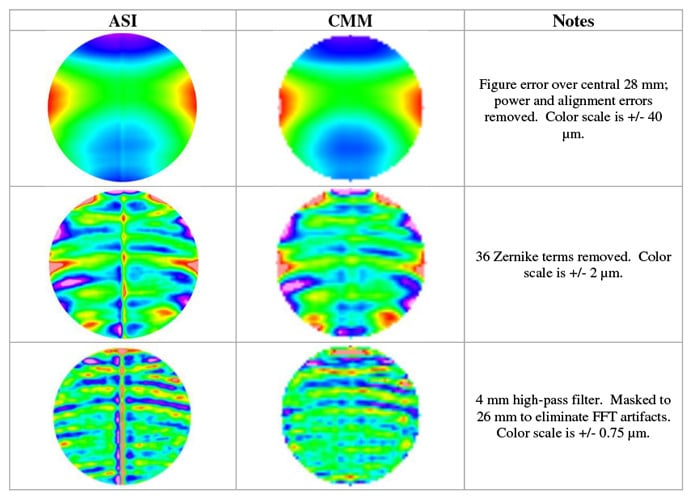
Figure 14 Height maps showing the figure error measured by the ASI and CMM.
The ASI and CMM instruments complement each other very nicely on a freeform part like this; the CMM is good at measuring low-order figure error over the entire part surface, and the ASI can be used to provide much higher accuracy in the measurement of mid-spatial frequency errors. QED plans to use ASI metrology, along with CMM data, for future figure corrections of this part.
CONCLUSION
Capabilities in all areas of fabrication (grinding, pre-polish, MRF, metrology) are improving quickly, making fabrication of freeform optical surfaces possible today. While technologies such as single point diamond turning combined with CMM metrology have been producing freeform geometries for a number of years (typically of lower precision, e.g. IR or illumination applications), the fabrication of high precision glass freeforms is still limited. However, grinding, pre- polishing, finishing, and metrology technologies do exist that enable this capability, and improved processes are constantly being developed. Optimax and QED have demonstrated the capability to fabricate an extreme freeform surface out of fused silica, including generation, pre-polishing, MRF finishing, CMM metrology, and Subaperture Stitching Interferometry. As we further develop and refine these processes, the precision and complexity of possible freeform optics will only increase. It is important for the design community to understand what is possible (and not possible) so freeform designs can be leveraged when they can bring valuable benefits to an optical system.
References
[1] Forbes, G.W., “Characterizing the shape of freeform optics.” Opt. Express 20(3), 2483-2499 (2012).
[2] Nelson, J. D., Gould, A., Smith, N., Medicus, K., and Mandina, M., “Advances in freeform optics fabrication for conformal window and dome applications,”, Proc. SPIE 8708 (2013).
[3] Hall, C., Jones, A., Messner, B, and Hallock, B., “Magnetorheological Finishing of freeform optics,” Proc. SPIE TD- 04 (2007).
[4] Supranowitz, C., Fleig, J., Forbes, G.W., Kulawiec, A.W., Miladinovic, D., Murphy, P.E., “Increased Lateral Resolution of Spheres and Aspheres through Subaperture Stitching Interferometry,” Proc. Precision Interferometric Metrology, ASPE 2010 Summer Topical Meeting, Volume 49 (2010).
Proc. of SPIE Vol. 8884 888411-10
Downloaded From: https://www.spiedigitallibrary.org/conference-proceedings-of-spie on 6/14/2018
Terms of Use: https://www.spiedigitallibrary.org/terms-of-use